Maximizing Profits
Linear regression model. Maximizing profits on XLMiner.

Cleaning
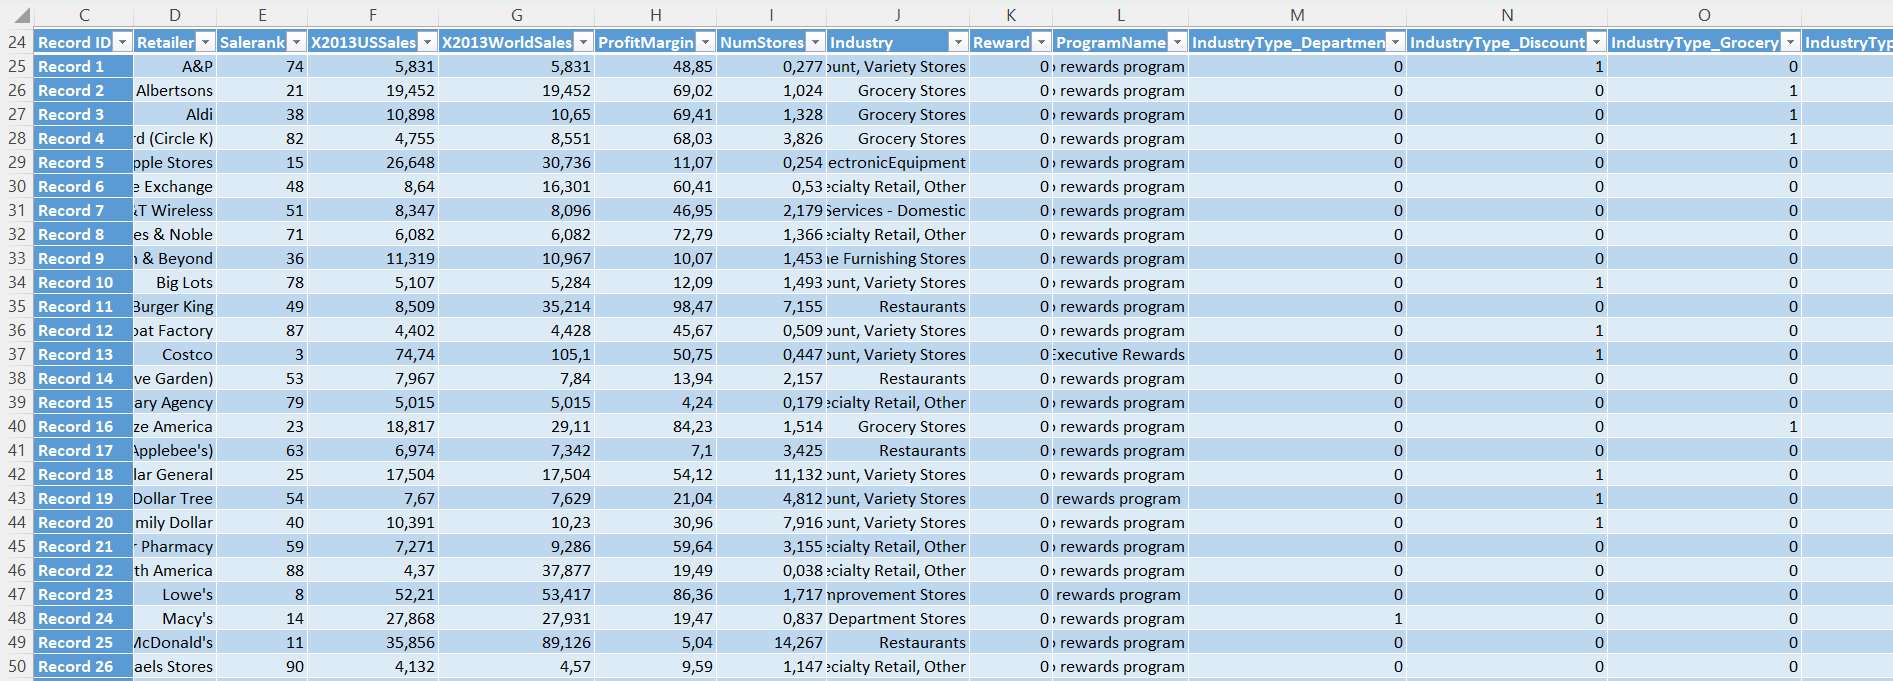
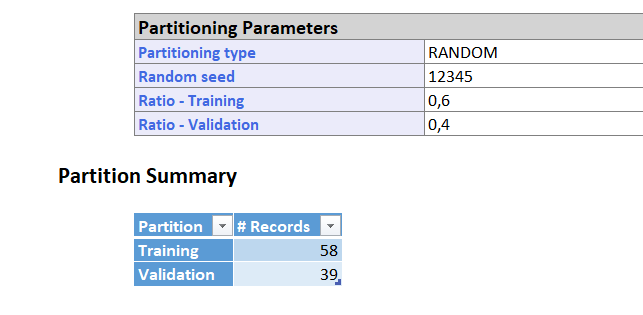
1) I removed 3 rows with NumStores = 0. 2)I created dummy variables on XLMiner using transform -> transform categorical data -> create dummies for the column "IndustryType". 3)I Used partition -> standard partition on XLMiner for the entire dataset training: 60%, validation set 40%

Predictive Analysis: Linear Regression
I used "X2013USSales" as the target field, or the variable i want to predict, since I want to predict the sales in the US for 2013. In the "Input Variables" , or predictors, I selected "Salerank", "X2013WorldSales", "ProfitMargin", "NumStores", and the dummy variables for "IndustryType".
I also normalized the data so that all variables have a mean of 0 and a standard deviation of 1. This technique helps reduce overfitting.

Results
Intercept: This is the estimated value of the target variable when all predictors are set to 0. In this case, it represents the estimated US sales in 2013 for a hypothetical retailer with no sales rank, no world sales, no profit margin, and no stores, operating in an unspecified industry type.
Salerank: This coefficient indicates that a one-unit increase in sales rank is associated with a decrease in US sales of $9.75 million, holding all other predictors constant.
X2013WorldSales: This coefficient indicates that a one-unit increase in world sales is associated with an increase in US sales of $313.66 thousand, holding all other predictors constant.
ProfitMargin: This coefficient indicates that a one-unit increase in profit margin is associated with an increase in US sales of $2.82 million, holding all other predictors constant.
NumStores: This coefficient indicates that a one-unit increase in the number of stores is associated with a decrease in US sales of $7.97 million, holding all other predictors constant.
IndustryType: The coefficients for the different industry types indicate the estimated difference in US sales between retailers in each industry type, holding all other predictors constant. For example, a retailer in the discount industry is estimated to have US sales that are $11.25 million higher, while a retailer in the grocery industry is estimated to have US sales that are $5.43 million higher.
An R-squared value of 0.867837 on the validation set means that the regression model explains about 86.8% of the variation in the sales data in the validation set. This is a reasonable level of accuracy.

Conclusions
Based on the coefficients of the model, the variable "IndustryType_Discount" has a positive coefficient, meaning that having more stores in the "Discount" category is associated with higher profits. However, it's important to note that correlation does not necessarily imply causation, and there may be other factors at play that affect profits.
The model provides a way to estimate the effect of changing the number of stores in each industry category on profits, but it does not take into account other important factors that may affect the decision-making process, such as market demand, competition, and operational costs.
While regression models can be powerful tools for making predictions and understanding relationships between variables, it's important to be aware of their limitations and potential sources of error.