Superstore Data
Superstore Data - Fictional company problem
Scenario
An American Superstore company wants to give a thank you card for Christmas to its 10 top customers on each region. It also wants to calculate how profitable it was the last four years.
The question:
Which are the top ten customers on each region based on sales for 2017?
What is the ROI (return on investment)?

Cleaning
I am working with the sample dataset “Superstore” here.
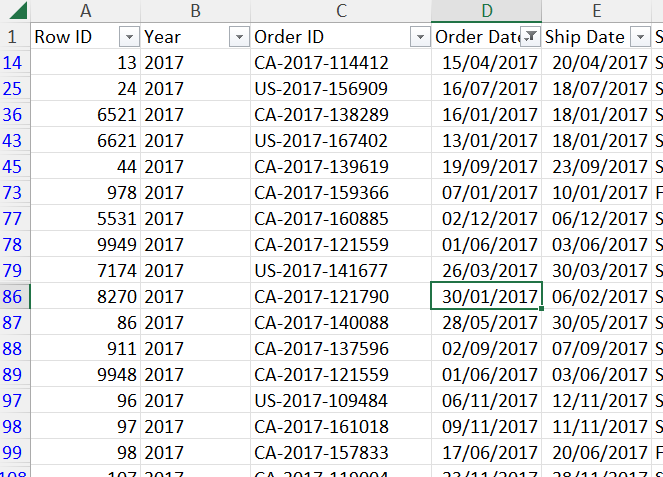
On the “Returns” tab I will create a new column called “year” using this function { =MID(B2;4;4) } to separate the year from the “Order ID” column.
Then I filter the “Year” to only 2017. There are 294 returns.
I have to exclude them from the “Orders tab” because there were no profits out of these orders.
I create a new column called “Cost of investment” and is calculated subtracting the profit from the sales.

Analysis
To find the top 10 customers of each region I create a pivot table of the new table so that “Order Date” is set to 2017 and the returned orders are excluded.
I set as Rows “Customer ID” and “Customer Name”, Values the SUM of “Sales” and Filters the “Region”.
Then I set the filter on each region separately and I use conditional formatting on the “Total” column to highlight the first 10 values.
To find the ROI, I calculate the sum of “profit” and “cost of investment”. Finaly I use this formula to calculate ROI : (Net profit-Cost of Investment) *100.

Conclusion
The top 10 customers for each region:
The ROI is calculated as 14.24% in four years, which is positive but could be better. On average, this company did a 15.6% discount on its products and sold 37873 products.